
Blog
Why trucks wait at the plant, and how suppliers measure turn time
Turn time is capacity. What keeps trucks waiting at the plant, how to measure gate-in to gate-out on each load, and how NewMile times the scale and load-out.

Turn time is how long a truck spends at your plant, from the moment it crosses your gate to the moment it leaves. It’s the number that decides how many loads a hauler can run in a day, and so how many tons go out of your gate. The way to manage it is to measure it on every load, stage by stage: arrival, scale, staging, load-out, departure. NewMile does that for you, automatically, on every load it tracks.
The old way to measure it is a stopwatch in the yard on a quiet Tuesday, or a comparison of the times printed on scale tickets. Both miss the hour that matters.
What is truck turn time at a plant?
It’s the time between a truck entering your site and leaving it. Three terms get mixed up:
- Turn time: gate-in to gate-out at your site.
- Loadout cycle time: how quickly a truck is loaded, ticketed, and released, in the words of Pit & Quarry’s P&Q University Handbook.
- Truck cycle time: the whole trip, including the drive to the job, the time at the jobsite, and the drive back.
Suppliers control the first two. They matter to haulers too: as the same handbook puts it, when delays occur at the quarry, customers can lose multiple loads across a shift.
Why trucks wait at the plant
Trucks rarely wait because one thing is slow all day. They wait because one stage can’t keep up at certain hours. Pit & Quarry breaks yard time into stages: weighing tare, traveling to the stockpile, waiting in the queue, loading, tarping, and returning to the scale. It recommends measuring each one. The usual culprits:
- One scale for inbound and outbound trucks, so both lines meet at the same deck.
- A loader serving too many lanes, or the wrong machine for the demand.
- Fast-moving products parked far from the load-out.
- A morning rush, when every truck is dispatched at the same time.
- Orders that surprise the plant, so the product or the crew isn’t ready when the truck shows up.
Waiting isn’t only a quarry problem. The Federal Motor Carrier Safety Administration has been studying driver detention time across trucking. It notes that earlier studies couldn’t separate normal loading time from waiting, and calls that “a critical data gap.” The fix starts with measurement that splits the visit into its parts.
Why a stopwatch can’t find the slow hour
A time study on a clipboard tells you about the trucks someone happened to watch, on the day they watched. Scale tickets tell you when a truck crossed the scale, not how long it sat before it got there. Spreadsheets turn both into a number nobody trusts by Friday.
NewMile takes a different approach. It times every tracked load, all day, every day, and splits the visit into the stages you care about.
| Question | Clipboard time study | Scale ticket times | NewMile |
|---|---|---|---|
| Which loads? | The ones someone watched | Loads that crossed the scale | Every load tracked by the driver app or Samsara |
| Which part of the visit? | Whatever the observer wrote down | The moments at the scale | Gate-in, loaded, gate-out, plus time in each zone you draw |
| History on day one | None. The study starts today | Past times, but only at the scale | A new zone is measured across the last year of loads |
| The busy hour | Only if someone was there | Only if someone builds the report | Medians by hour, day, week, or month |
| Effort | A person in the yard | Manual comparison | Automatic |
NewMile timings cover loads tracked by GPS from the NewMile driver app or Samsara.
That third row is the one we like best. A clipboard study starts today. A NewMile zone starts a year ago.
How to measure turn time, step by step
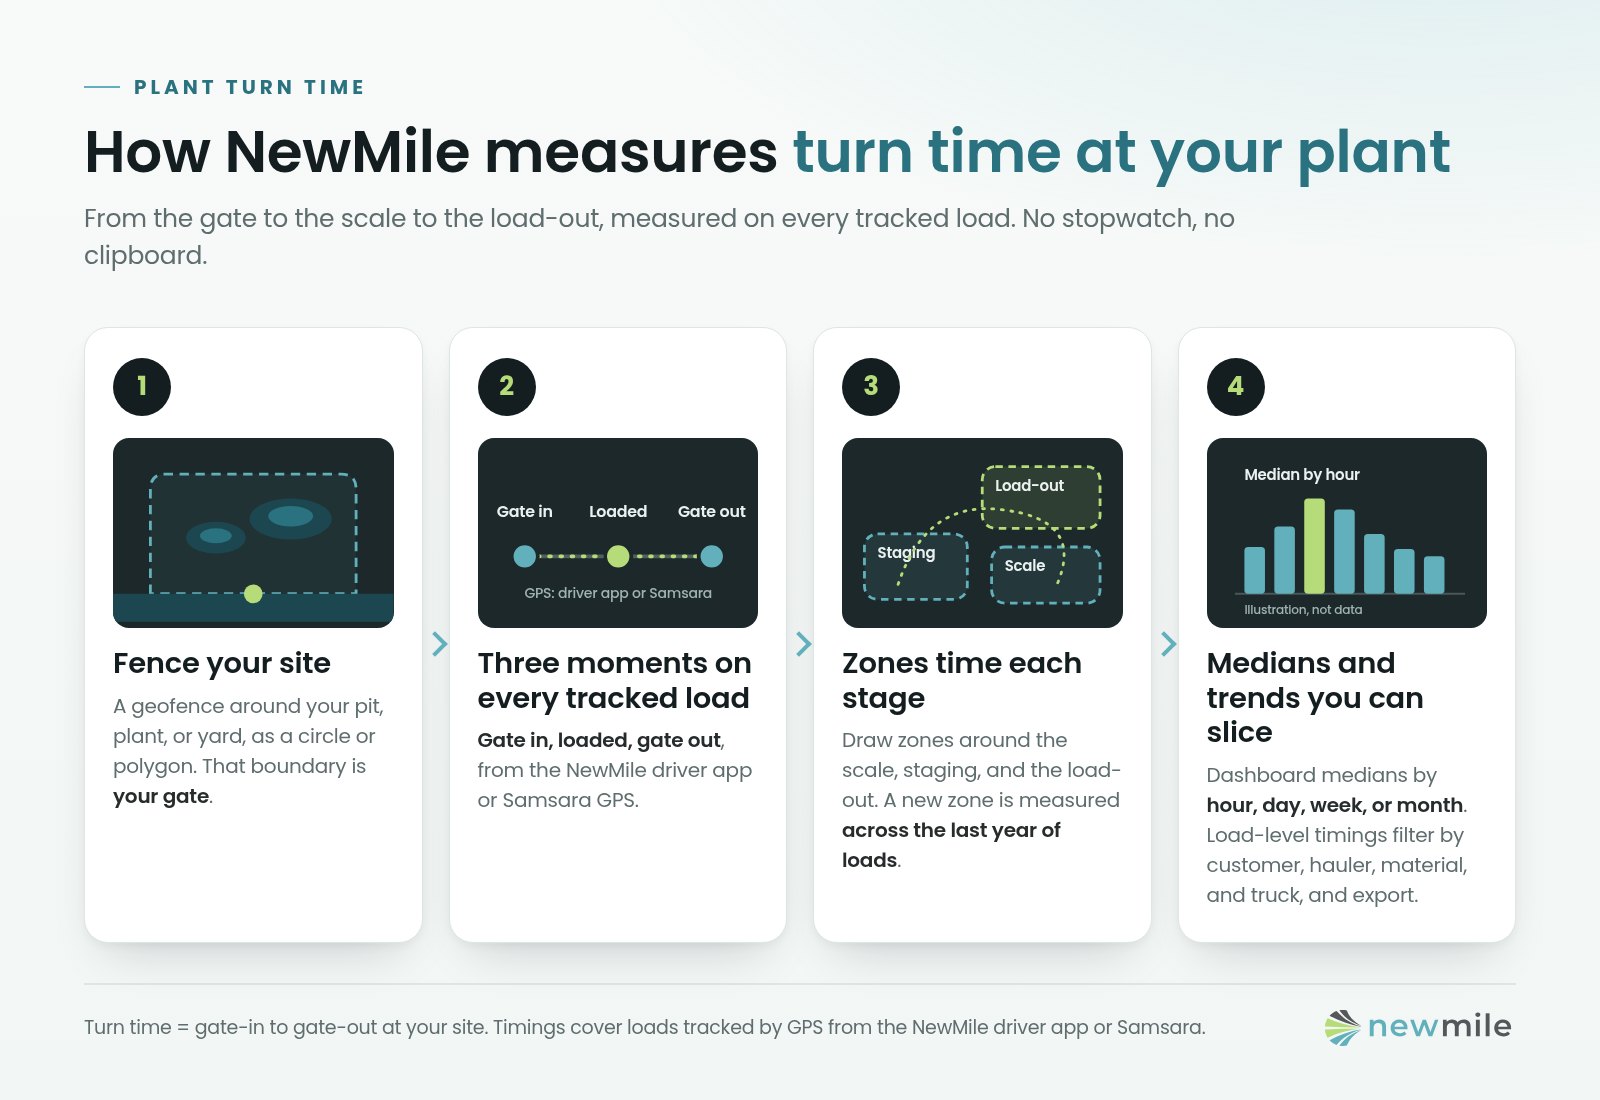
- Fence the site. Draw a geofence around your pit, plant, or yard, as a circle or a polygon. That boundary defines your gate.
- Record three moments on every load: when the truck arrives, when it’s loaded, and when it leaves. Gate-in to gate-out is your turn time. Gate-in to loaded shows the wait plus loading. Loaded to gate-out shows ticketing and exit.
- Split the yard into zones. Put one around the scale, one around the load-out, and one around the staging area where trucks queue. Time in each zone tells you where the minutes go.
- Watch medians, not averages, by hour of day and by day of week. A single broken-down truck can wreck an average. The median shows what a typical driver experienced, and the hourly view shows when the line forms.
- Slice it and share it. Break it down by customer, hauler, material, and truck. Export it for the people who plan staffing and loader coverage.
What to do with the number
Once you can see which zone is slow and when, the fixes are familiar. Pit & Quarry’s handbook lists most of them:
- Separate inbound and outbound traffic at the scale, or add drive-up ticketing so drivers stay in the cab.
- Move fast-moving products closer to the load-out and run one-way traffic through the yard.
- Match loaders to demand in the hours the median climbs.
- See tomorrow’s orders today, so product and crews are ready before the first truck arrives. NewMile gives suppliers next-day order visibility for this reason.
Then measure the same zone again. Before and after, on the same site, with every tracked load counted. That’s how a change earns its keep.
How NewMile measures turn time
NewMile is built for the whole delivery, from order to plant to ticket to invoice. For material suppliers, the plant-side view:
- Times every tracked load at your site. GPS from the NewMile driver app or Samsara, checked against your site’s geofence, records when each truck arrived, when it was loaded, and when it left.
- Times the stages inside your yard. Draw zones as circles or polygons and name them the way your yard works. NewMile reports how long trucks spend in each one, and backfills a new zone across the last year of loads.
- Shows the trend, not just the day. Your location dashboard shows median time at location and time to load, trended by hour, day, week, or month.
- Lets you slice and export. Load-level timings filter by date, customer, hauler, material, and truck, and export to CSV.
- Keeps it in the same place as your tickets and orders, so the truck that waited is the same load on the ticket and on the invoice.
A few limits, plainly: NewMile times loads tracked by its driver app or Samsara, so coverage depends on which haulers serving your plant run their loads in NewMile. It doesn’t run your scale. Its job is to show where the time goes. See more on NewMile for suppliers, and how digital scale tickets keep the proof attached to every load.
Want to see turn time at your own plant, down to the scale and the load-out? Request a demo. It’s a short walkthrough with no commitment.
Frequently asked questions
How do you measure truck turn time at a quarry or plant?
Record three moments for every load: when the truck enters your site, when it's loaded, and when it leaves. Gate-in to gate-out is the turn time; gate-in to loaded and loaded to gate-out show where it went. Then split the yard into stages, such as the scale, staging, and the load-out, and track the median by hour and day. NewMile does this automatically for every load tracked by its driver app or Samsara.
What's the difference between turn time and cycle time?
Turn time is the truck's time at your site, gate-in to gate-out. Loadout cycle time, as Pit & Quarry defines it, is how quickly a truck is loaded, ticketed, and released. A truck's full cycle adds the drive to the job, the time at the jobsite, and the drive back. Suppliers control the first two directly.
Why do trucks wait so long at the plant?
Usually a stage in the yard can't keep up: one scale for trucks coming and going, a loader serving too many lanes, fast-moving products parked far from the load-out, or a morning rush when every truck shows up at once. Measuring each stage separately shows which one it is.
Can GPS measure time at the scale and the load-out separately?
Yes. In NewMile you draw zones inside your site, as circles or polygons, and name them the way your yard works. NewMile reports the time trucks spend in each zone, and when you draw a new zone it's measured across the last year of loads at that site.
Should I track the average or the median turn time?
The median. One truck stuck behind a breakdown can drag an average up for the whole day. The median shows what a typical truck experienced, and tracking it by hour shows when the backup really happens. NewMile reports medians by hour, day, week, or month.
Does NewMile time trucks that aren't on NewMile?
No. Turn times come from GPS on loads tracked by the NewMile driver app or Samsara. Trucks hauling outside NewMile don't have those timings, so coverage grows as more of the haulers serving your plant run their loads in NewMile.
See the whole picture on a walkthrough.
A 15-minute demo on loads, tickets, and invoices — no commitment.